GDHF: DHIS 2, OpenLMIS and OpenSRP Integration POC
BAO, Ona and VillageReach will showcase a proof of concept integration at the Global Digital Health Forum in December 2017.
Time/Date: December 6 at 1:30 - 4:00pm
The following page is the notes and discussion of putting that lab together.
Integration lab description
Many countries considering their health information system (HIS) strategy have expressed a growing interest in integrating systems and incorporating systematic analysis of Logistic Management Information System (LMIS) and Health Management Information System (HMIS) data to improve supply chain performance and service delivery. Specifically for immunization supply chains, interest is rapidly growing in data for management and the provision of high-quality data for accurate and informed decision-making. For this lab session, participants will see a demonstration environment on three systems: DHIS 2, OpenLMIS and OpenSRP, all of which manage both LMIS and HMIS data within immunization supply chains across countries.
The OpenLMIS, DHIS 2, and OpenSRP Integration Lab aims to present a proof-of-concept for systems integration, demonstrating how supply chain and health information systems can bring data together for decision-making and reporting while maximizing data capture and reducing redundancies. The lab will hold a discussion on the key steps, data governance decisions, and technical requirements behind a DHIS 2 (HMIS), OpenLMIS (LMIS), and OpenSRP (point of care vaccine registry) integration. The lab will demonstrate how data captured in varying systems can be visualized together in another system to drive better decision making. During the lab, participants will see how an electronic LMIS (OpenLMIS) feeds stock level and inventory data into the HMIS (DHIS 2) where it can be compared against vaccine coverage information reported by a digital registry (OpenSRP). Additionally, participants will see how stock levels of vaccines can be viewed side-by-side for a particular facility or geographic area. Throughout the lab, participants will be asked to share experiences and join the discussion to identify lessons learned and additional opportunities.
Use Cases: Integration and interoperability
Scope for the proof of concept integration
- Specific indicators that leverage data from BOTH HMIS and LMIS:
- Vaccine utilization rate = vaccines administered / vaccines available for consumption
- Not in Scope:
Classification from DVDMT. Wastage comes from LMIS, Coverage/Targetted comes from HMISFor details and an example of classification please see the "Class" tab in the DVDMT attached below.Classification: presents by facility/district the trend of performance in term of categorization. Four (4) performance categories (which are by vaccine) are defined as follow:a) clas_A: for a facility/district with coverage >= targetted and wastage rate <= expected.b) clas_B: for a facility/district with coverage >= targetted and wastage rate > expected.c) clas_C: for a facility/district with coverage < targetted and wastage rate <= expected.d) clas_D: for a facility/district with coverage < targetted and wastage rate > expected.Example DVDMT (District Vaccine Data Management Tool) for Maputo: DropBox
2. If time, populate relevant vaccination reports/indicators (potentially portions of the DVDMT) leveraging data from DHIS 2, OpenSRP and OpenLMIS.
- LMIS reports = Full Stock Availability and Closed Vial wastage
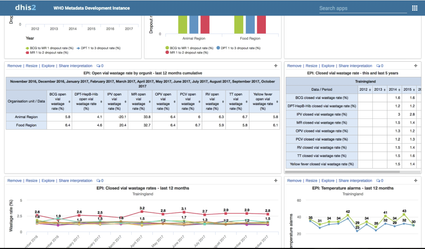
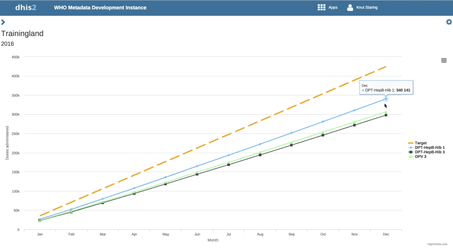
- HMIS reports = WHO DHIS 2 module (there are quite a few charts)
Working document for setting up the integration: https://docs.google.com/document/d/1N3RwOzImB0orubdQAbmyxBAJyZP9eMjcH34CVKhatNQ/edit
Presentation
Working Google Presentation: https://docs.google.com/presentation/d/1ZqY6lAUm84tWIK1XTbawe7OVih4O4Aenk1vSP1N-Ryc/edit?usp=sharing
Meeting Notes
On , we'll have a working session to start outlining the presentation.
- Matt expressed concern about the engineering effort to do the integration. Reiterated that we are only focused on a few indicators.
- Steffen (low tech script) for a couple of variables. A handful of data elements
- They didn't have any stock information indicators.
- Steffen mentioned we could build a couple indicators around stock levels.
Some ideas for the demo/presentation
What is the live integration looking like? (folks need to do some more research to figure which indicators)
- Sign into all three systems
- Show the data within DHIS 2
What do we actually do in the lab?
1 hour ofshort introductions to the 3 systems, concepts/principles/approach- 1 of demo/integration and brainstorm
- Explain the various roles and why you are using that system and why the integration helps you do your job
- Could talk about the use cases we are demonstrating
- Also, highlight other opportunities of integration
- If you could see across all the systems (real-time), what could you do differently?
Check in meeting
- Steffen was able to get access to the app
- Need to add the stock data elements
- Only works in DHIS 2.25
- Populated with the Sierra Leone data
- VR needs to come up with the mock data for stock details
Steffen will send out loginsMary Jo: to share the four elements we could take a look at- Steffen and Matt to schedule a technical walk through
To Dos
- Mary Jo Kochendorfer (Deactivated) to send the cleaned DVDMT to Matt Berg (Unlicensed) and Steffen Tengesdal
- Figure out what data we can use
- Mary Jo Kochendorfer (Deactivated) to set up weekly meeting
- Check with Nora, Vidya around the value adds for the DVDMT information. What should we focus on?
- OpenLMIS team at VillageReach will have more todos to prep for this presentation
- Matt Berg (Unlicensed)
- Look at the indicators
- Be informed of the data elements from WHO which we should map to
- Push in what we (OpenSRP) currently have and map within DHIS 2.
- Figure out how these map to the generalized indicators we are using for the demo as these are Zambia specific
- Setup instance of OpenSRP to point at BAO DHIS 2
- If we get data, potentially create a map showing some of the high level indicators (eg. donor view)
- Steffen Tengesdal
- Spin up DHIS 2 server
- OpenLMIS setup on AWS
- Get indicators for DVD-MT (from WHO ideally) and import to DHIS 2
- Configure dashboards (Graphs/charts/maps) based on DVD-MT data
- Get script in place to pull OpenLMIS data into DHIS 2
We Mary Jo Kochendorfer, Steffen Tengesdal, Matt Berg need to start making a presentation
- Best practices around faciltiy management
- Why it matters and how it mess you up later
- Best practices setting up product classifcation
- Why it matters and how it will mess you up later
- Source systems and data governance
- Benefit of using multiple systems versus using one system to do it all (roles, etc.)
- What are the wins when combining data from two systems (which keeping value within domains)? What opportunities exist?
Meeting with WHO/Oslo on
Steffen Tengesdal, Matt Berg (Unlicensed) and Mary Jo Kochendorfer (Deactivated) to meet with Knut on at 7:00am Pacific to learn about the DVDMT module in DHIS2.
NOTES:
The meeting went great and we hope to obtain access to the module and apps for the POC. The following presentation was shared by Knut. We focused on the Routine Immunization piece.
Routine health facility information system (RHIS)
- Address critical gaps/harmonize and disseminate standards
- Catalyse join support
- Align investments
- Master facility lists, analytical outputs, package of data standards & tools, indicators metadata
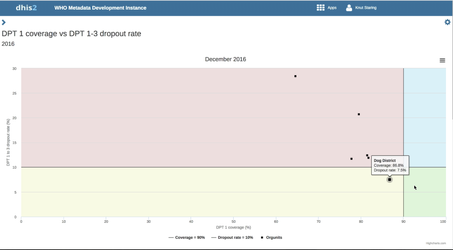
- A standard health app
- Coverage vs dropout rate (box plot
The following presentation was shared by Knut and is NOT the final module/application details. Please make sure to contact Knut or DHIS 2 directly for information on the module and applications. The information below is prior to release and still in the piloting phase.
Next Steps
- Mary Jo sent out the GDHF blurb and DISC indicators to Knut
- Knut to share the PPT he presented
- Steffen to follow up with Knut to see if we can gain early access to the module
OpenLMIS: the global initiative for powerful LMIS software