Summary
Reporting rate report show the percentage of facilities that are reported and those facilities that didn't reported in a given geographical area. This report is used to follow up on non-reporting and late-reporting facilities and priorities facilities in need of support or supervision. The non-reporting facilities list can also be sent via email to the district officer.
Components
Reporting rate report will provide a Google Map based geographical report that shows different shade color layer on each region of the country based on their reporting performance for a give reporting period. On the map each region will be represented by a poly shape based on Geo data of the region's boundary and the shape will be rendered on the Google Maps. The Google map layer for the district will be shaded based on the combined reporting performance of the member facilities.
The report also has a tabular report section that listed all the districts in the country with reporting performance of the member facilities.
| Anchor | ||||
|---|---|---|---|---|
|
...
Color code | Reporting status |
Red | Non Reporting |
Yellow | Partial reporting |
Green | Fully Reporting |
Black | Not Expected |
Table 2: Color representation for the map shape shades and tabular report bar.
The color shaded districts on the map report is clickable. When it gets clicked a popup will appear at the place map is clicked and will shows tabular data regarding how many facilities:-
...
eLMIS implementation
Reporting rate report on eLMIS can be accessed from UAT site at https://uat.zm.elmis-dev.org or by running eLMIS locally by checking out the source code from {+}https://bitbucket.org/elmis-tzm/open-lmis.git+ and one can follow the README.md file to quickly setup the project on local machine.
To access the report from UAT server, one needs to have a login account with role 'View Reports' attached to it. 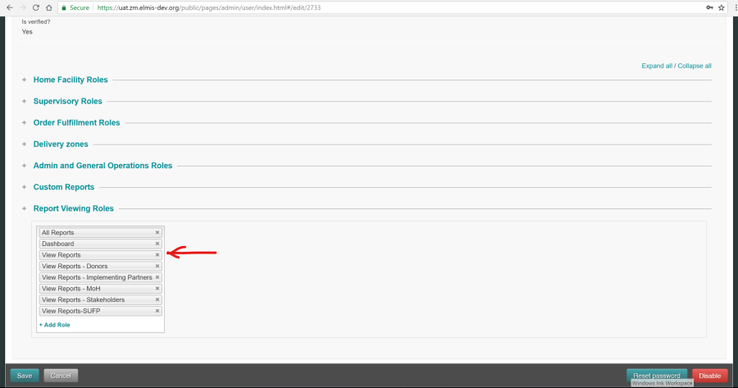
Fig 8: Report viewing role.
After successful login, user can got to Reports > Report Status > Reporting rate by Facility on the upper navigation menu. If the report link is not there or not visible, check the report role 'View Reports' is added to the login account.
Developer Resources
The Consumption report is developed using Jasper report from PDF and XLS output and HTML and AngularJS for the HTML preview.
In the eLMIS code base, all the reports are place under module called 'reports '
https://bitbucket.org/elmis-tzm/open-lmis/src/develop/modules/report/src/main/java/org/openlmis/report/ |
Under the report module we have three folders
- Java - Java code for fetching data from the database and transforming it to REST API
- Resources - This folder hold compiled jasper reports
- Template - This folder hold Jasper JRXML files. This is the place where we can find the report design to change report implementation.
How to compile report design file
To compile report files, user should navigate to the home directory of the project and issue the following command.
gradle compileJasperReport
Apart from the above command, run gradle task also compiles the report files as part of running the application. compileJasperReport compiles the jrxml files found under Template folder and move the compiled file under folder Resources.
Report End point
Under java folder listed above, we can find all the backend resources for fetching and transforming report data from db. Under this folder there a number of other dedicated folder that their name can give some meaning. Amount all the folder there is one called controller which we can find a REST controller for the starting point for most report data.
For Consumption report, the report will fetch data from org.openlmis.report.controller.GeoDataController. We can see lots of REST resource in the class but for our report we will focus on getReportingRateReport method. All export format of the report will call this resource via URL {_}http://ip:port_/gis/reporting-rate.json with parameter query string.
Call hierarchy
org.openlmis.report.controller.GeoDataController#getReportingRateReport
> org.openlmis.report.mapper.lookup.GeographicZoneReportMapper#getGeoReportingRate
How is the HTML report organised
The HTML report is designed with HTML and AngularJS. Basically all report format PDF, XLS and HTML use the same java REST endpoint to fetch a report data from the db. All HTML reports gets loaded by the following file modules/openlmis-web/src/main/webapp/public/pages/reports/main/index.html.
All report related resources like js and css files and also html partial pages will be loaded in to the above file using AngularJS routing feature.
When one browse to the consumption report URL on the site, AngularJs will load index.html page and render
modules/openlmis-web/src/main/webapp/public/pages/reports/maps/partials/reporting-rate.html partial page in to it.
If one opens and see the reporting-rate.html file its possible to see HTML section that will render the list of report filters that we saw on the screenshot. For example, to add a program filter in reporting-rate.html we can add with the following code block.
<program-filter class="form-cell horizontalFilters" required="true"></program-filter>
The above code renders the program report filter in the report page. Each report filters are composed as angular directive. One can find the list of filter directive definitions at
modules/openlmis-web/src/main/webapp/public/js/reports/shared/directives/filters.js
Each report filter that one can see in the report can be found in filters.js. Those directives calls a backend service to populate the filter control with data. The angular services that will be called by each filters and reports are found in
modules/openlmis-web/src/main/webapp/public/js/shared/services/extension-services.js
Once the report get loaded and when the report viewer selected data on all required filters, $scope.OnFilterChanged method will be called in the following js file
modules/openlmis-web/src/main/webapp/public/js/reports/maps/controller/reporting-rate-controller.js
With in this AngularJS controller method, the java REST endpoint will be called to fetch the report data.
On the report page, there are two buttons at the top of the page for exporting the report on other formats. If a user wants to export the current HTML report to PDF, he/she need to click the button with the label PDF. When that button get clicked, $scope.exportReport method of the reporting-rate-controller.js
file will be called.