Notes: Reporting SOW Kick-Off
Present: Josh, Peter, Brandon, Mary Jo, Matt
18 Oct 2017
Reporting Deep Dive
Full Stock Availability
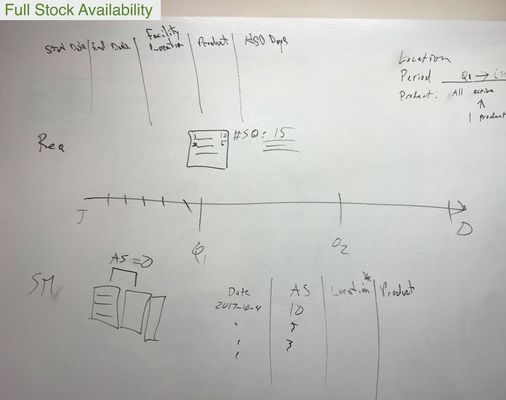
We drilled in on the 'Full Stock Availability' DISC indicator and its data sources.
DISC indicators: https://drive.google.com/file/d/0B7xtV6aZH_ckWUlqbVpQemJ6M1E/view
Detail:

Assumptions
- For the Full Stock Availability indicator
- Reporting periods exactly match requisition periods
- But, if we can aggregate up to a coarser reporting period that's fine
- e.g. requisition periods are monthly, starting at the first day of the month and we product reports quarterly
- But, if we can aggregate up to a coarser reporting period that's fine
- Reporting periods exactly match requisition periods
- Locations represent a single facility
- When calculating % of districts with at least X% of facilities with full stock availability
- Requisition data includes information on all health facilities in the district
Demo data needed
- JSON file with requisition data, same as what's served by the API
- useful keys for Full Availability indicator
- period
- start date
- end date
- facility location
- stockout days
- product ID
- product name
- commodity type
- geographic zone, e.g. district
- [latitude, longitude]
- period
- useful keys for Full Availability indicator
- JSON data with mapping from geographic zone to region
- maybe shape files for geographic zone and region
- JSON data with mapping from product to commodity
- use this to find the commodity from the product ID
- JSON file stock card data, same as what's served by the API
- useful keys for Full Availability indicator
- date
- facility location
- number of stock on hand
- when this hits zero we do not have full availability for the reporting period
- useful keys for Full Availability indicator
VillageReach/OpenLMIS Responsibilities
Possible responsibilities for OpenLMIS core team to support the reporting work:
- ATOM feed for OpenLMIS requisitions approved
- Webhook support in OpenLMIS endpoints
- ETags in OpenLMIS endpoints
- adding filters onto OpenLMIS endpoints (such as by approved date)
OpenLMIS is also adding HL7 FHIR facility/location master lists. Reporting stack could use that when it becomes available.
Discussion
Question: How often does the data change and how frequently does the report need to be refreshed?
- In terms of what is practical, real time is practical.
- There may be situations where we need to "split the columns" and re-process the historical data to re-run a query with a new grouping. Those changes will not happen real-time.
- In order to demo the system, we would need to run/refresh the data during the live demo event.
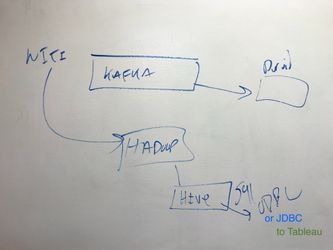
Question: Where does Tableau fit in this picture?
- It is sort of like Superset. You could point Tableau at this. Query Hadoop through Tableau, or index Hadoop through Druid. Then Tableau could query Druid. Tableau can use HIVE to provide a JDBC or ODBC SQL way to query the Hadoop data.
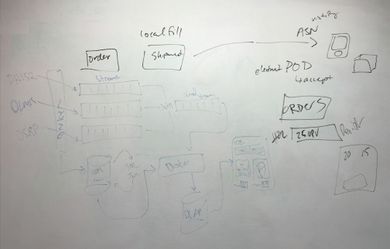
Mobile
Two different diagrams from earlier morning conversations about Mobile (black drawing from Mary Jo) and Reporting (blue drawing from Peter):
OpenLMIS: the global initiative for powerful LMIS software