[VLMIS]-Web Mapping/GIS
Goals/Scope
VLMIS
There is a need to support enhancing the existing web-LMIS to include a detailed module for interactive web maps of routine LMIS data. The scope of this module is to make it possible to visually display web-LMIS on a map to assist the use of web-LMIS data in decision making. This module will be capable of visually displaying key indicators that users can interact with to gain understanding of the status and impact of the supply chain and secondly use these maps to demonstrate to others the insights that they have gained from maps. Each month, along with other logistics data, users will see the new maps of the web-LMIS data.
The extent of the interactive will be interactive allowing the user to zoom in and out, with a maximum zoom in will be to district level for the cLMIS and Tehsils for the vLMIS and zoom out to the whole country of Pakistan. Also the user will be able to enter in a province, district and tehsils (in the vLMIS) and the map will zoom into the selected region. The user will be able to pan around whole map and finally the user will be able to click on each district and get detailed pop-up showing the actual data and the numerator and denominator is relevant of the indicator been mapped for example for stock status the actual month of stock, stock on hand and AMC. All maps will also have a “data issues” category this is for data that has been identified as inconsistent that will need to be checked before it can be used for decision making for example negative stock on hand balance. The all maps will contain a legend and scale bar. This level of interactivity will enable the user to see and explore the data been represented. Given this primary goal is to encourage users to interact with the data thus the focus is on interactivity, this impact to ability to design web maps for been printed, therefore, there will not be any specific print function.
The key indicator maps that the will have interactive maps for both the cLMIS and vLMIS are listed below. Full descriptions of the each map is provided in section 6.2 List of maps.
For both cLMIS and vLMIS;
- Stock Status (Month of Stock)
- Consumption/Doses Administered/AMC
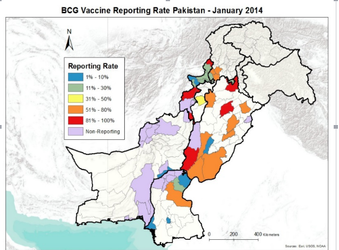
- Reporting rate
Contraceptive LMIS only
- CYP
Vaccines LMIS only
- Wastage
- Wastage vs Reporting Rate
- Expiry alerts (less than 6 months)
- Vaccine Coverage
- Cold Chain Capacity / Population
- CCM Working Status
- CCM Reporting Status
- CCM by type (Lower Priority)
- CCM Aging (Lower Priority)
Other types of interactivity that have been identified as likely to useful are a time line scrollbar allowing the user to scroll from one time period to another and advanced query functions for example selecting all districts with 1 month SOH for x commodity, or AMC with greater than 100 units of x commodity are not included in this scope for this version of the web mapping module. The reasoning is two-fold the time period available development for the first release of the web mapping module limited the level of interactivity, secondly before the time line scrollbar and advanced query function could be incorporated after the initial interactivity was built and functioning. However, these additional functions are considered in the design phase so they can be easily incorporated in the next release of the web mapping module.
Background
Assumptions
- All users are expected to know how to use basic Internet tools.
The interactive web maps are been designed to intuitive to be used someone familiar with basic internet tools, these include for example navigate using mouse, use dropdown menus.
- Open source software
The software to generate and support this is all open source that has strong community support behind software, the reason is that using open source software removing/reduces licensing cost and constraints. Using a software with a strong community support is reduces the risk of a software becoming obsolete and a larger pool of resources available to maintain and update the application.
- Background tiles for 3rd party
Interactive maps will be overlaid on a map tile service provided by a 3rd party provider (eg Google, Open Layers, Open Street Map). The interactive web maps will function without the maps, however, the map tiles will provide context where the map is in the world. Generally 3rd party provider the tile are provided “as is” they cannot be adjusted, this is a known and is highly unlikely to cause any issue, if it is identified as issue options can be explored to resolve this, however, would have cost implications.
- Survey of Pakistan
The main assumption is that based on the description of the role of Survey of Pakistan in the Survey and Mapping Act 2013, given that interactive web mapping are to use data either provided by the Survey of Pakistan or matching the data from the Survey of Pakistan for the boundaries of Provinces, Districts and Tehsils. Then this activity compiles with the Survey and Mapping Act 2013 that is the use of “geospatial data among all users … to enhance and improve objective decision making.” By using the data from the Survey of Pakistan we will doing what the Survey of Pakistan is promoting use of official geospatial data for improved decision making.
User Stories
| # | Title | User Story | Label | Importance | Notes |
|---|---|---|---|---|---|
| 1 | Generate with indicators | As Federal/Provincial/District user, I want to select filters and perform search for data to be rendered as map. Indicator filters include: Stock Status (MOS), CYP , Consumption/Doses Administered/AMC, Reporting rate (District/Province), Wastage, Expiry alerts (less than 6 months), Vaccine Coverage, Cold Chain Capacity , CCM Working Status (Functional/Non-Functional), CCM Reporting Status, CCM Aging, Wastage vs Reporting Rate, VVM stage 2, Completeness of Reporting, | VLIMS | Nice to Have |
Diagrams
Dependencies
| Description | Link |
|---|---|
Open Questions
Below is a list of questions to be addressed as a result of this requirements document:
| # | Question | Outcome | Status |
|---|---|---|---|
| 1 |
Out of Scope
OpenLMIS: the global initiative for powerful LMIS software