Burn-up for 3.0 Release
- Brandon Bowersox-Johnson
Goal
The purpose is to help the team reflect on its progress, velocity, and work remaining. The burn-up chart does this by using the story points completed each sprint to forecast when all story points for the 3.0 release will likely be completed. As with anything agile, this is a forecast and it is subject to change. As more sprints are completed, the "cone of uncertainty" will narrow and our forecasts will be more accurate.
Burn-Up Chart
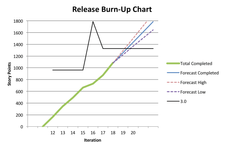
Last updated: March 1, 2017 (end of Sprint 20 at 3.0.0 release day)
This chart is updated at the end of each sprint to reflect the story points completed during that sprint. Sprint 12 was the first sprint working on 3.0. Sprint 11 was the last sprint for 3.0 beta. Our goal is to have all the 3.0 story points completed before the end of Sprint 20 in order to conduct a release of version 3.0.0 (was released March 1, 2017).

Methodology
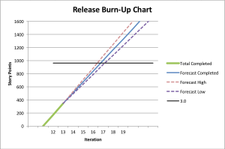
The green Total Completed line always shows the cumulative story points that have been completed towards the 3.0 release. It excludes work on 3.0 beta.
Forecast Completed is a prediction of future story point completion based on the average velocity from the past 3 sprints. The High and Low forecasts represent plus and minus one standard deviation of the past 3 sprints' velocities.
The black 3.0 release line on the chart is based on an estimated 1330 story points. It is adjusted as the developers generate additional story point estimates on the tickets and as we decide to change or remove certain features from the 3.0 scope.
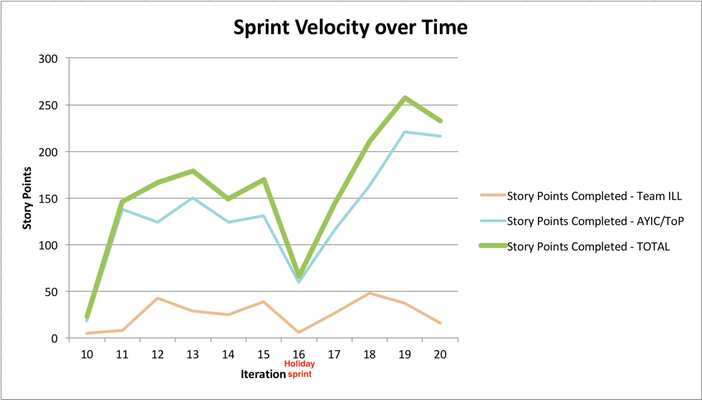
Velocity
How many story points did each team complete during each sprint (aka iteration). The velocity is not cumulative.
Scope & Epic Estimation
The initial estimate of 965 story points in 3.0 was based on an epic-level estimation exercise Team ILL conducted during sprint 12. During Sprint 15, a review of all the epic progress generated a review estimate of 1790 story points. During Sprint 17, another review of progress resulted in scope reductions and an updated estimate of 1330 story points. As we approached the 3.0 release, we reviewed scope and epic progress more frequently to adjust the scope and estimates. We 1330-story point estimate remained through the 3.0.0 release.
Initial Estimate: 965 points
In the initial exercise in sprint 12, we reviewed each epic for 3.0 and grouped them into Small, Medium, Large and Huge epics. A few epics fell in between Small and Medium. We also size-estimated a few completed epics where we had story points on the completed tickets, so we used that to roughly correlate the epic sizes to a number of story points that epic's tickets are estimated to contain. We used a Fibonacci sequence with seed values 15 and 20 to apply story points to each epic size.
Small Epics (15 points x 3): Receiving Process, Shipment from external ERP, GS1 Support; also we sized the completed epic User Auth. & Password Management as small, and it contains 18 completed story points
Small-Medium Epics (20 points x 4): Budgeting Feature, Order Export, Offline Requisitions, Contract tests
Medium-Small Epics (35 points): we sized 2 completed epics, Configuration & Reference Data and Orders (PoD) as Medium-Small, and they contained an average of 39 points each
Medium Epics (55 points x 12): Reference data refactoring, Requisition template 3.0, Requisition UI, Reference UI, Upload Reference Data, System Administration, Electronic Stock Card, Local Fulfillment, Program data, Jasper Report Framework, Modular Architecture and Extension Framework, Configurable Notification Service
Large Epics (90 points x 2): Requisition Improvements, Dev & Build Infrastructure
Total: 965 story points
Revised Estimate at Sprint 15: 1,790 points
In sprint 15, we reviewed the scope. Now that we have real data on progress during work on v3.0 epics, we found that the 965-point estimate was off by a factor of two. To complete the same scope it would require 2,140 points, not 965. So we identified changes within epics and a few epics that do not need to be part of the v3.0 release. Specifically, the 1,790 number assumes that 4 epics are removed from v3.0: Local Fulfillment, Receiving Process, Budgeting Feature, and Shipment from External ERP (Upload Reference Data, is still included in the 1,790 number).
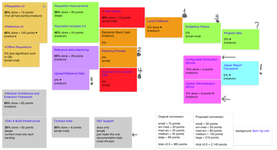
Details of estimates and points are in a new worksheet inside the spreadsheet attached at the bottom of this page, and visualized in this board:
More activities to revise and refine the estimates and priorities are forthcoming.
Revised Estimate at Sprint 17: 1,330 points
In Sprint 17, we reviewed the scope again. We made additional reductions in scope by prioritizing specific tickets within a few epics as well as removing another epic from scope (Upload Reference Data epic). Based on this scope, we estimate that 1,330 story points will be needed to complete all the functionality that is planned for version 3.0. Details of the estimates and epics are in the worksheet attached at the bottom of this page.

Why estimate epics?
Why did we have to use epic-level estimation? Some of the epics in version 3.0 do not have all of their tickets yet—some don't have any tickets—so epic-level estimation was the best way to quickly estimate and begin tracking the amount of work in 3.0. The goal is to have an imperfect but useful burn-up to track our progress. The epic-level story points may be over- or under-estimated, but we hope that the relative sizes are correct (e.g., Medium is bigger than Small). It's also the case that some bugs will get filed each sprint which will add a small percentage of story points. When we update the chart each sprint, we will adjust the total number of story points (raise or lower the black line) to address these factors and to incorporate better data as more epics get a complete set of tickets and as the developers generate story point estimates on those tickets.
Spreadsheet (Excel)
The burn-up chart is created in Excel with data pulled from JIRA and updated when each sprint ends. The Excel burn-up chart is used instead of the JIRA built-in Version Report for 3.0 because the Excel version allows more control over the axes and display. The Excel version also forecasts the future velocity by using past velocity of the team from prior sprints during 3.0 beta work, which JIRA does not do.
The Excel spreadsheet and charts are based on a popular template explained in this AgileWhys blog post.
Excel (.xlsx latest version):
History
Below are historical snapshots from the end of each sprint.


Related content
OpenLMIS: the global initiative for powerful LMIS software