Consumption Report Functional Requirement
- Adugna Worku (Unlicensed)
Summary
Consumption report shows an aggregate consumption of products for all facilities in a specified location (district or zone) of a country for a specified period. The report will help how much is a product consumption based on geographic area.
On current implementation in eLMIS, apart from aggregated report, the report can be seen disaggregate – meaning the report viewer will have the ability to see consumption data for each facility found in a specified geographic area. In addition to that the report can show reported consumption based on regular, emergency or both.
In the report, the aggregate product consumption data of product will be shown in terms of unit of dispensing, number of packs and also adjusted consumption.
Components
The consumption report will have the following columns:
- # (Row number starts from 1)
- Product code
- Product name
- Reported consumption (amounts consumed in units of dispensing)
- Reported consumption per pack (amounts consumed in number of packs)
- Adjusted consumption (adjusted for new patients or for stockout days depending on the program).
Report filters:
Name | Input type | Description |
Program | Dropdown list | Loads all programs that are active and based on user's supervisory node. It's a required field. |
Schedule | Dropdown list | Required field and data will be loaded based on the program selection. |
Year | Dropdown list | Required field and shows list of years starting from the program start data till current year in yyyy format. |
Period | Dropdown list | Required field and shows a list of periods based on schedule selection |
Geographic Zone | Dropdown list | Geographic zones with in the country in terms of country > province > district hierarchy. Defaults to the country level. |
Facility Type | Dropdown list | Optional list of all facility types in the system |
Facility | Dropdown list | Optional list of all facility types in the system |
Product category | Dropdown list | List of product types based on selected program |
Product | Multi select | When a user clicks on the multi select field, list of products will be shown based on selected product category. User can select multiple products using this filter. |
Consumption type | Checkbox | Three optional check boxes. The check box lists are 'Regular', 'Emergency' and All. The 'All' check box will be selected by default when the report loads for the first time |
View Disaggregate | Checkbox | It's an optional filter. When the field is selected the report will show facility consumption data instead of aggregate consumption of products |
To access this report, first the user needs to login and should have the right to access the report. Once the user browse to the report, a page with the list of report filters mentioned above will appear.
Validation
When the page loads for the first time, all report filters should be unselected except Geographic zone and Consumption type filters. Geographic zone filter should be defaulted to the country (the upper most level) and under Consumption Type the checkbox 'All' should be selected.
To see report data in the report, the report viewer needs to select all the required filters - Program, Schedule, Year and Period. Once all the required fields are selected, the report will try to fetch data from server. If there are some un-selected filters which are required, the report won't try to load a data from server.
All the required filters have an asterisk signed red color coded (*) will be seen beside the filter label.
Fetching
Once all the required fields are selected the report will automatically loads the data. One can change the geographic level to fine tune the report data. It's also possible to use other non-optional fields to load the report. 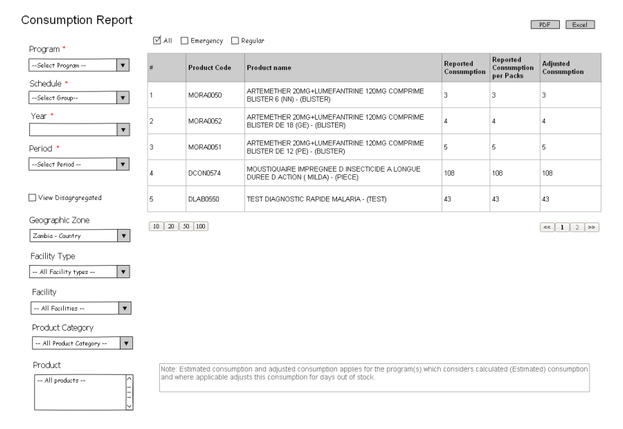
Fig 1: Consumption report mock up
If the report viewer selects, 'view Disaggregate' check box, the report will no more show the aggregate consumption. Instead, facility based consumption will be shown and an additional Facility Name column will be visible before product code column. 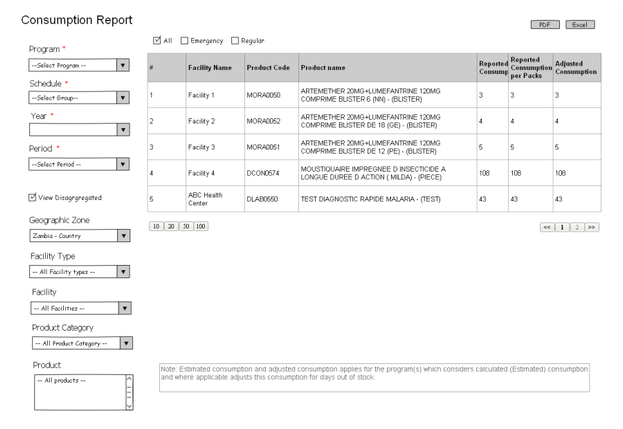
Fig 2: Consumption report based on facility. Note that 'View Disaggregate' is selected
Under Consumption type, 'ALL' will be selected by default. But if user selects Regular checkbox, the consumption report only shows regular consumption data. If only 'Emergency' is selected emergency consumption will only be seen in the report. If both get selected, the report will be a combined data of emergency and regular consumption.
User can compare specific products consumptions only by filtering report products. The products filter can accept more than one product
Pagination
If there is a report data based on the selection, the data will be seen in a tabular format on the HTML page with pagination buttons at the bottom of the page. The pagination is on client side and requires all the data to be loaded prior. The pagination links will be based on the row count of the data.
Apart from the pagination, there are small, horizontally stacked list of buttons on the bottom of the page to define the number of rows to show in a single paginated page. The list of buttons will have the following labels 10, 25, 50 100 consecutively. For example, If user clicks button with label '10', the number of rows that will be shown in the current page will be 10.
Data Formatting
On the tabular report all the columns except Product code and Product name, shows a number, right aligned with thousands separator. Product code and Product name shall be aligned to the right.
Exporting
On the upper side of the report there will be two buttons for exporting the current report to PDF or XLS format. When the user clicks the PDF button, PDF version of the report will be opened in a new tab or in a new page. When the Excel button clicked, XLS export of the report will be downloaded.
The PDF output will have the country logo and below to that Report filters data used to fetch the report.
eLMIS implementation
Consumption report on eLMIS can be accessed from UAT site at https://uat.zm.elmis-dev.org or by running eLMIS locally by checking out the source code from {+}https://bitbucket.org/elmis-tzm/open-lmis.git+ and one can follow the README.md file to quickly setup the project on local machine. To access the report from UAT server, one needs to have a login account with role 'View Reports' attached to it.
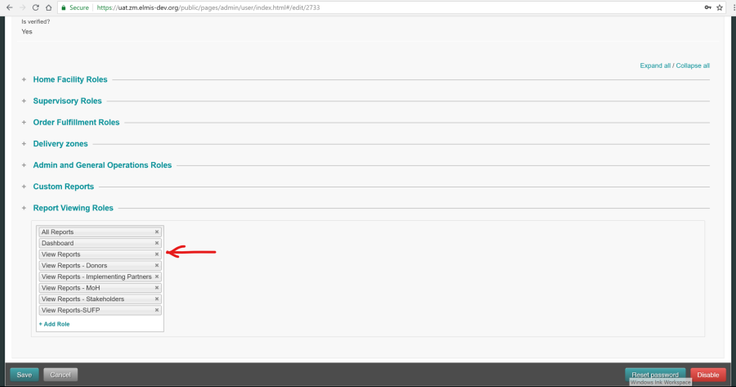
Fig 3: Consumption report viewing role.
After successful login, user can got to Reports > Consumption > Aggregate Consumption from the upper navigation menu. If the report link is not there or not visible, check the report role 'View Reports' is added to the login account. 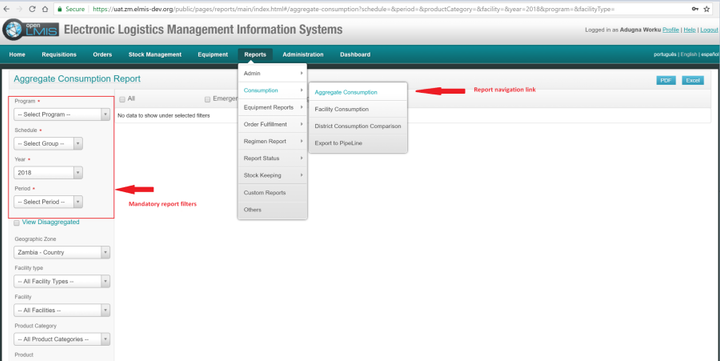
Fig 4: Consumption report navigation link and report filters
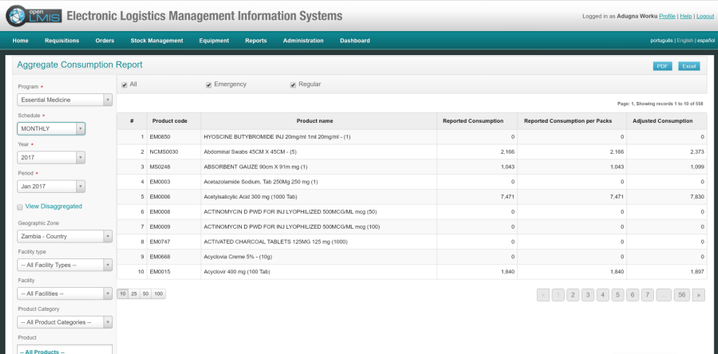
Fig 5: Consumption report with report data
Developer Resources
The Consumption report is developed using Jasper report from PDF and XLS output and HTML and AngularJS for the HTML preview.
In the eLMIS code base, all the reports are place under module called 'reports '
https://bitbucket.org/elmis-tzm/open-lmis/src/develop/modules/report/src/main/java/org/openlmis/report/ |
Under the report module we have three folders
- Java - Java code for fetching data from the database and transforming it to REST API
- Resources - This folder hold compiled jasper reports
- Template - This folder hold Jasper JRXML files. This is the place where we can find the report design to change report implementation.
How to compile report design file
To compile report files, user should navigate to the home directory of the project and issue the following command.
gradle compileJasperReport
Apart from the above command, run gradle task also compiles the report files as part of running the application. compileJasperReport compiles the jrxml files found under Template folder and move the compiled file under folder Resources.
Report End point
Under java folder listed above, we can find all the backend resources for fetching and transforming report data from db. Under this folder there a number of other dedicated folder that their name can give some meaning. Amount all the folder there is one called controller which we can find a REST controller for the starting point for most report data.
For Consumption report, the report will fetch data from InteractiveReportController. We can see lots of REST resource in the class but for our report we will focus on getAggregateConsumptionData method. All export format of the report will call this resource via URL {_}http://ip:port/reports/reportdata/aggregateConsumption.json_ with parameter query string.
Call hierarchy
org.openlmis.report.controller.InteractiveReportController#getAggregateConsumptionData
> org.openlmis.report.service.AggregateConsumptionReportDataProvider#getReportBody
> org.openlmis.report.mapper.AggregateConsumptionReportMapper#getAggregateConsumptionReport
> org.openlmis.report.builder.AggregateConsumptionQueryBuilder#getQuery
How is the HTML report organised
The HTML report is designed with HTML and AngularJS. Basically all report format PDF, XLS and HTML use the same java REST endpoint to fetch a report data from the db. All HTML reports gets loaded by the following file
modules/openlmis-web/src/main/webapp/public/pages/reports/main/index.html
All report related resources like js and css files and also html partial pages will be loaded in to the above file using AngularJS routing feature.
When one browse to the consumption report URL on the site, AngularJs will load index.html page and render
modules/openlmis-web/src/main/webapp/public/pages/reports/main/partials/aggregate-consumption.html partial page in to it.
If one opens and see the aggregate-consumption.html file its possible to see HTML section that will render the list of report filters that we saw on the screenshot. For example, to add a program filter in aggregate-consumption.html we can add with the following code block.
<program-filter class="form-cell horizontalFilters" required="true"></program-filter>
The above code renders the program report filter in the report page. Each report filters are composed as angular directive. One can find the list of filter directive definitions at
modules/openlmis-web/src/main/webapp/public/js/reports/shared/directives/filters.js
Each report filter that one can see in the report can be found in filters.js. Those directives calls a back-end service to populate the filter control with data. The angular services that will be called by each filters and reports are found in
modules/openlmis-web/src/main/webapp/public/js/shared/services/extension-services.js
Once the report get loaded and when the report viewer selected data on all required filters, $scope.OnFilterChanged method will be called in the following js file
modules/openlmis-web/src/main/webapp/public/js/reports/main/controller/aggregate-consumption-controller.js
With in this AngularJS controller method, the java REST endpoint will be called to fetch the report data.
On the report page, there are two buttons at the top of the page for exporting the report on other formats. If a user wants to export the current HTML report to PDF, he/she need to click the button with the label PDF. When that button get clicked, $scope.exportReport method of the aggregate-consumption-controller.js file will be called.
Related content
OpenLMIS: the global initiative for powerful LMIS software